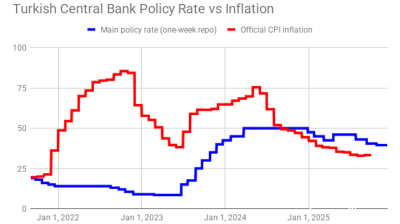
The Turkish economy grew by 4% last year, after expanding at 3% in 2014, despite political uncertainties in the first half of the year, renewed clashes in the country’s Kurdish region and geopolitical tensions. The main drivers behind the economic growth last year were consumer and public spending.
According to data of the statistics office TUIK the Turkish economy grew by 5.7% y/y in the last quarter of 2015, above the market consensus forecast of 5.2%, after growing 3.9% y/y in Q3, and 3.7% in Q2. The economy expanded at 2.5% in the first quarter of 2015.

TUIK calculates that the size of the Turkish economy was $720bn in 2015, corresponding to a per capita income of $9,144 versus $10,284 in 2014. The 4% growth rate was in line with the government’s forecast for 2015.
On a seasonally and calendar adjusted basis, GDP expansion slowed to 0.7% q/q in the fourth quarter of 2015, from 1.2% q/q in the previous quarter.
Households’ consumption, which accounted for nearly 67% of GDP, increased by 4.7% y/y in Q4, up from 3.6% y/y in the previous quarter. In the whole of 2015, consumer spending rose by 4.5% compared to 2014 when household consumption increased by only 1.4%.
Government final consumption, another key driver behind economic activity, showed a robust 8.1% y/y increase in the last quarter versus the 8% y/y rise in Q3.
Gross fixed capital formation, on the other hand, was up 3.5% y/y in the fourth quarter after remaining flat in Q3. In the whole of 2015, total investments increased by 3.6%, which compares with the 1.3% contraction in the previous year.
Data also showed that private investments rose by 1.7% y/y in Q4 after falling 2.1% y/y in Q3. In 2015, private investments increased by 2.7% after a weak 0.3% increase in 2014.
Exports also recovered in the final quarter of last year. Turkey’s exports increased 2.1% versus 1.4% y/y decline in the previous quarter while imports continued to fall. According to data, the country’s imports fell by 2.6% y/y in Q4 that followed a 1.2% decline in the previous year.
On the production front, industrial output showed a 7.2% y/y in Q4, up from 1.5% in Q3. In the whole of 2015, industrial production increased by 3.3% versus 3.5% in 2014. Manufacturing output was up 7.8% y/y in the last quarter comparing favourably with the 1.3% y/y rise in the previous quarter. The construction sector, which expanded at 2% y/y in Q3, grew by 5.4% y/y in Q4. The wholesale and retail trade sector grew by 4.6% y/y versus 0.3% expansion in the third quarter.
The government expects the Turkish economy to grow by 4.5% this year. The performance of the Turkish economy has been better than expected since the beginning of the year: industrial production increased by 5.6% y/y in January, well above the estimates, and the capacity utilisation rate in manufacturing increased to 74.3% in March from 73.5% in the previous month.
The latest PMI survey signalled a fourth successive monthly improvement in business conditions in Turkey’s manufacturing economy in February. Both consumer confidence and business sentiment improved recently.
The government’s decision to hike the minimum wage by 30% for 2016 will definitely boost domestic demand. But the central bank will need to take necessary steps to contain the adverse effects of this increase on inflation which currently hovers around 9%. The European Commission said in its latest Winter Economic Forecast that private consumption was expected to increase 3.4% this year versus 4.2% in 2015.
Despite a wave of terrorists attacks on the country’s two largest cities, consumer confidence increased by 0.5% m/m in March, after declining in the previous three months. Business confidence rose for a third consecutive month in March, the index hitting 106.
But, the problems in the tourism sector may start to weigh on the economy in the coming months, through job losses and extra financial pressure on hotels and tourism-related service companies. Foreign tourist arrivals dropped 10% y/y in February, marking a decline for the seventh consecutive month.
The loss of tourism revenues can also create problems for the country’s banks. Hakan Ates, CEO of private lender Denizbank, recently said the tourism industry owned as much as $17bn to banks, Bloomberg reported on March 29.
Commenting on the Q4 GDP data, Tim Ash at Nomura said: “I would think that growth might be 1% lower, at 2.5-3%, albeit given the Q4/15 performance the risks now might be on the upside. Slower growth would though have a silver lining, in a likely further moderation in Turkey’s key Achilles heel, the still large current account deficit.”
| Real GDP growth by Sectors | ||||||||||
| (%) | 2014 | Q1/14 | Q2/14 | Q3/14 | Q4/14 | 2015 | Q1/15 | Q2/15 | Q3/15 | Q4/15 |
| Agriculture, forestry and fishing | -2.1 | 3.7 | -2.7 | -5.1 | 1.3 | 7.6 | 3.9 | 7.7 | 11.4 | 2.8 |
| Industry | 3.5 | 6.3 | 3.3 | 2.8 | 1.8 | 3.3 | 0.4 | 4.0 | 1.5 | 7.2 |
| Mining and quarrying | 5.6 | 7.7 | 8.6 | 4.2 | 2.4 | -2.3 | -8.1 | -5.0 | -2.6 | 6.0 |
| Manufacturing | 3.7 | 6.5 | 2.9 | 2.5 | 2.7 | 3.8 | 1.2 | 4.8 | 1.3 | 7.8 |
| Electricity, gas, steam and air conditioning supply | 4.1 | 3.9 | 4.9 | 7.0 | 1.4 | 2.4 | 1.3 | 2.0 | 1.6 | 4.0 |
| Water supply, sewerage, waste management and remediation activities | 10.8 | 11.7 | 10.6 | 11.7 | 9.2 | 10.4 | 6.8 | 8.8 | 12.9 | 12.7 |
| Construction | 2.2 | 5.8 | 3.4 | 2.0 | -2.1 | 1.7 | -2.7 | 1.9 | 2.0 | 5.4 |
| Services | 4.3 | 6.2 | 3.8 | 3.3 | 3.7 | 4.8 | 4.0 | 4.1 | 5.0 | 6.1 |
| Wholesale and retail trade | 1.9 | 4.3 | 0.7 | 0.3 | 2.4 | 2.1 | 1.1 | 2.3 | 0.3 | 4.6 |
| Transportation and storage | 3.1 | 4.2 | 2.9 | 2.7 | 2.6 | 2.9 | 1.1 | 2.1 | 2.3 | 6.0 |
| Accomodation and food service activities | 2.8 | 1.7 | 2.8 | 4.0 | 1.5 | 4.6 | 5.0 | 2.7 | 6.0 | 3.5 |
| Information and communication | 3.3 | -2.2 | 5.6 | 3.2 | 6.7 | 3.3 | 9.2 | -1.1 | 1.5 | 3.7 |
| Financial and insurance activities | 7.3 | 13.7 | 7.1 | 5.4 | 4.2 | 10.0 | 6.7 | 9.9 | 13.6 | 9.8 |
| Real estate activities | 2.8 | 2.1 | 2.1 | 3.0 | 3.8 | 2.6 | 3.1 | 3.0 | 2.8 | 1.5 |
| Professional, scientific and technical activities | 10.9 | 11.9 | 9.8 | 10.8 | 10.9 | 11.4 | 14.1 | 10.2 | 10.2 | 10.6 |
| Administrative and support service activities | 5.7 | 7.6 | 5.4 | 4.4 | 5.3 | 5.3 | 6.3 | 4.8 | 2.6 | 6.8 |
| Public administration and defence; compulsory social security | 2.4 | 4.2 | 3.6 | 1.9 | 0.3 | 2.2 | -0.6 | 0.5 | 5.1 | 3.8 |
| Education | 6.5 | 5.7 | 6.3 | 6.6 | 7.6 | 5.4 | 7.1 | 5.1 | 3.2 | 5.9 |
| Human health and social work activities | 5.6 | 5.1 | 6.9 | 6.2 | 4.4 | 3.1 | 5.2 | 2.3 | 2.1 | 2.3 |
| Arts, entertaintment and recreation | 6.9 | 12.5 | 7.4 | 5.5 | 1.9 | 5.3 | 2.6 | 5.7 | 4.5 | 8.6 |
| Other service activities | 2.2 | 3.3 | 2.0 | 2.2 | 1.4 | 0.0 | 0.4 | -0.2 | -0.4 | 0.3 |
| Activities of household as employers | 2.8 | 1.6 | -1.8 | 5.8 | 5.5 | -1.4 | 0.9 | -5.2 | -5.4 | 1.6 |
| Sectoral total | 3.4 | 6.1 | 3.2 | 1.9 | 2.9 | 4.6 | 2.8 | 4.3 | 4.8 | 6.2 |
| Financial intermediation services indirectly measured | 7.3 | 16.7 | 10.3 | 2.6 | 2.5 | 14.4 | 9.6 | 15.8 | 18.3 | 13.7 |
| Taxes-subsidies | 2.6 | 5.4 | 0.6 | 1.1 | 3.4 | 8.4 | 6.5 | 8.6 | 7.9 | 10.3 |
| Gross domestic product (Purchaser's price) | 3.0 | 5.2 | 2.4 | 1.8 | 3.0 | 4.0 | 2.5 | 3.7 | 3.9 | 5.7 |
| source: tuik | ||||||||||
Data
Ukraine's trade deficit doubles to $42bn putting new pressure on an already strained economy
Ukraine’s trade deficit has doubled to $42bn as exports fall and imports balloon. The balance of payments deficit is starting to turn into a serious problem that could undermine the country’s macroeconomic stability.
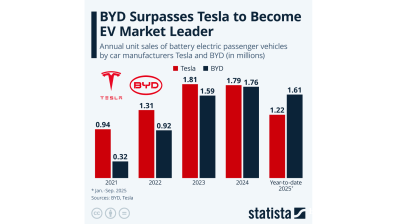
BYD surpasses Tesla to become EV market leader – Statista
While Chinese manufacturer BYD already pulled ahead of Tesla in production volume last year, with 1,777,965 battery electric vehicles (BEV) produced in 2024 (4,500 more than Tesla), the American manufacturer remained ahead in sales.
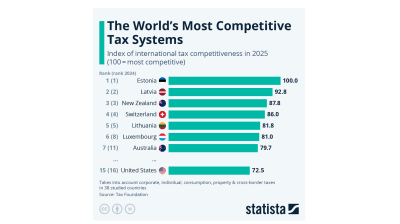
Estonia has the world’s most competitive tax systems for the 11th year in a row – STATISTA
The Tax Foundation has released its International Tax Competitiveness Index which highlights the most competitive tax rates in different countries around the world. For the 11th consecutive year, Estonia had the highest score in the index.
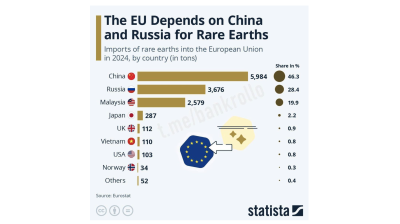
EU rare earth supply dominated by China and Russia - Eurostat
The European Union remains heavily dependent on China and Russia for rare earth imports, with nearly three-quarters of its supply sourced from the two countries in 2024, according to data published by Eurostat and reported by Statista.
